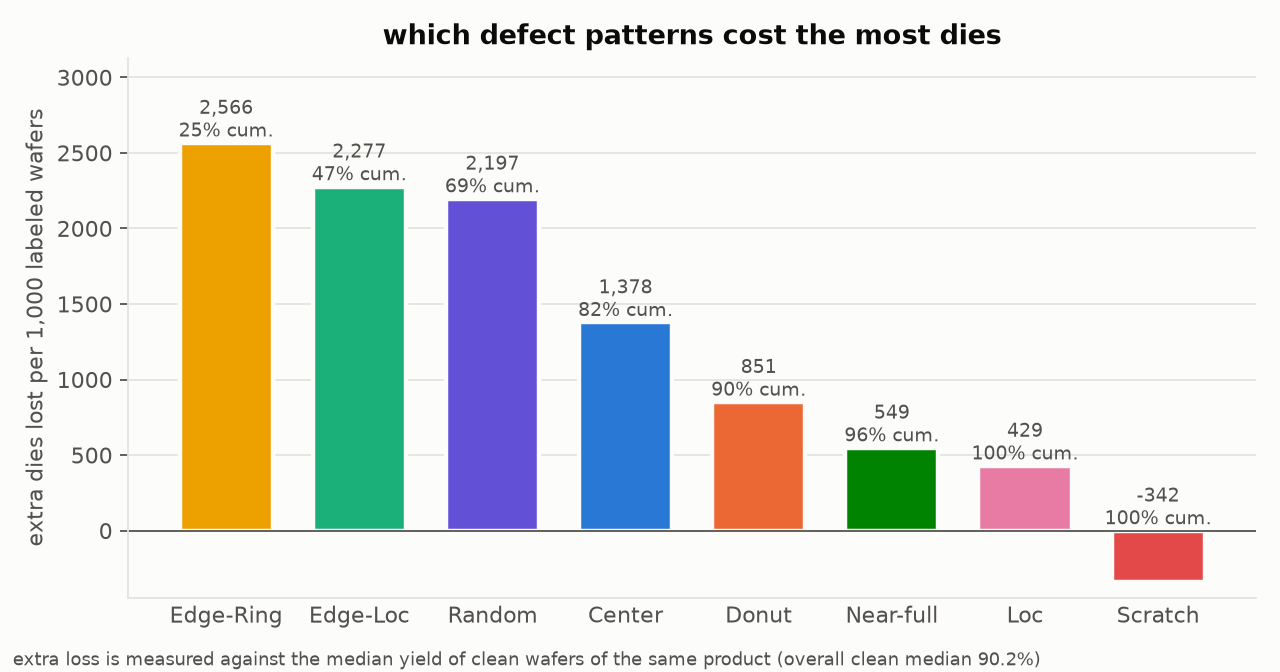
Result in contextEdge-Ring and Edge-Loc account for 47% of the excess die loss across 172,950 labeled wafer maps. All 8 defect patterns cluster within lots, and 502 of 7,025 lots are excursion lots, 361 of them Edge-Ring.
The problem
A wafer bin map shows which dies failed at wafer sort. For a yield engineer, the pattern’s name matters less than how many dies it costs and whether its cause was shared by the whole lot, like a chamber or a recipe.
WM-811K (Wu, Jang, and Chen, IEEE TSM 2015) contains 811,457 production wafer maps. 172,950 of them carry one of nine labels: eight defect patterns and "none".
What I did
I wrote the Python workflow and logged each analysis choice, including the options I turned down, in the repository’s decision log.
Ranking patterns by die loss
Clean wafers still lose dies to background defects, so I counted only the loss above a clean baseline. Each wafer is compared with the median yield of clean wafers of the same map size, which stands in for the product because the dataset has no product ID. Sizes with fewer than 30 clean wafers use the overall clean median of 90.2%. Reporting extra dies per 1,000 labeled wafers combines how often a pattern appears with how much each occurrence costs.

Testing whether patterns come in lots
For lots with at least 10 labeled wafers (7,025 lots, 165,591 wafers), I counted how many same-pattern wafers share a lot. I compared that count with 200 label shuffles that keep lot sizes and pattern frequencies but break any link between lot and pattern. I also checked whether a pattern repeats in the next slot more than its lot mix would predict.
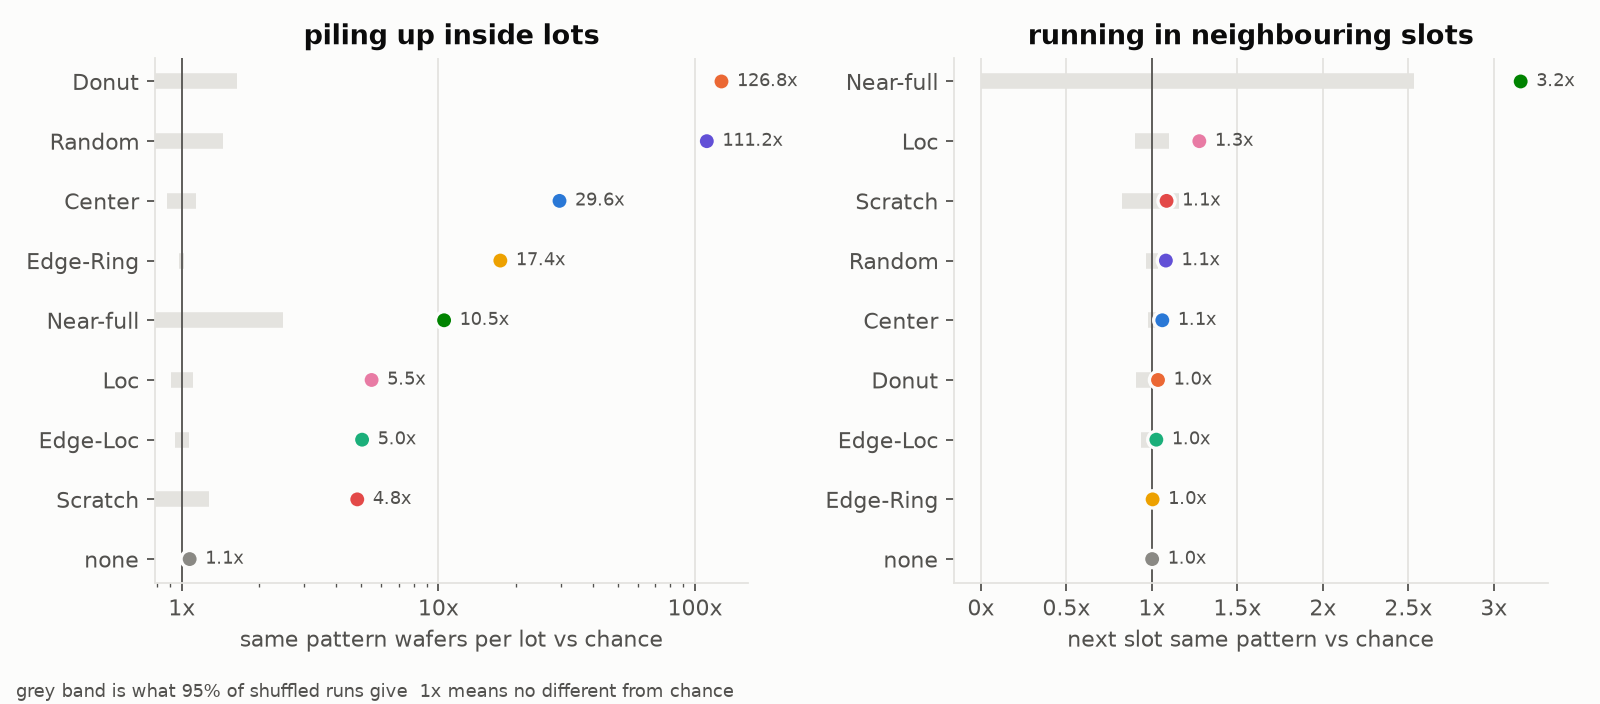

All 8 defect patterns cluster within lots far above chance (p ≤ 0.005 for each, the smallest value 200 shuffles can give). Slot order adds little on top of the lot effect. I flagged a lot as an excursion when one defect pattern covers at least half of its labeled wafers: 502 lots meet that bar, and 361 of them are Edge-Ring.
Root-cause hypotheses
For each pattern I compiled literature-based root-cause hypotheses across etch, CMP, lithography, and deposition, with the first fab check to run and the signal that would confirm it. The table marks which rows are engineering hypotheses and which general points have a checked source.
What it means in a fab
Edge-Ring and Edge-Loc lose the most dies, so I would start with edge-related conditions such as edge film thickness, etch focus-ring wear, and CMP retaining-ring life.
Because patterns tend to fill whole lots, the first step for a flagged lot is pulling its tool and chamber history. The “Random” pattern clusters by lot too, at 111 times chance. Its failing dies are scattered with no shape, which fits a lot-wide cause like contamination or a particle event.
Limits
Map size is only a proxy for product. The labeled subset leans toward worse wafers (median yield 89.4% against 94.8% unlabeled), so “per 1,000 labeled wafers” is not a fab-wide rate. Labels may have been assigned lot by lot, which could inflate the clustering, and the data cannot rule that out. The dataset has no tool, chamber, or recipe fields, so the root causes remain hypotheses to check against real process history.
Code and sources
The repository has the analysis scripts, result tables, and run steps, plus later classifier work. The decision log records each method choice, and the root-cause table lists sources and their verification limits.
Dataset: M.-J. Wu, J.-S. R. Jang, and J.-L. Chen, “Wafer map failure pattern recognition and similarity ranking for large-scale data sets,” IEEE Transactions on Semiconductor Manufacturing, 2015. Figures from repository commit 9ad5d0d, reviewed November 4, 2026.